
How healthy are Westcountry rivers? Why the numbers need a closer look
How healthy are the rivers and freshwater bodies of the Westcountry?
The Environment Agency has just published its latest data on the ecological condition of England’s rivers and surface waterbodies. In the South West, 19.6% of surface waterbodies are rated as being in ‘good’ ecological condition, slightly higher than the national figure of 14.3%.
At first glance, this might seem like a straightforward measure of river health. But, as with much environmental data, the picture is more complicated.
Our rivers face a range of pressures, including sewage spills, agricultural run-off and pollution from roads. The latest Environment Agency data provides a useful insight into freshwater quality, and how it varies across different places and over time. However, it also has some important limitations, so it is best considered alongside other available evidence.
Why do the numbers look worse than in 2019?
It is tempting to compare the latest figures directly with those from 2019. In that year, 21.1% of surface waterbodies in the South West were classified as having ‘good’ ecological status. The latest figure is around 19.6%.
Nationally, there has also been a decline, from 16.3% in 2019 to 14.3% now.
But this does not simply mean that our rivers have become less healthy.
Part of the apparent change is because the Environment Agency has changed how and where it assesses waterbodies. This includes a new system for classifying heavily modified waterbodies, the removal of some classifications based on ‘expert judgement’, and updated baselines.
There are also differences in how frequently and extensively individual waterbodies are monitored. Waterbodies considered to be higher risk, or where there is greater uncertainty, are more likely to receive monitoring. Where no new measurements are available, classifications can sometimes be ‘rolled over’ from previous years.
All of this means that the 2019 and latest figures cannot be treated as a simple like-for-like comparison. The regional change is certainly interesting, but to understand what is really happening to our rivers, we need to look beneath the headline figures and into the underlying data.
What does ‘good ecological status’ actually mean?
There is another important point to understand when interpreting these figures.
Ecological status is assessed using a range of different measures, including things such as fish populations, water quality and habitat. But the overall classification follows a strict ‘one-out, all-out’ rule.
This means that if a waterbody fails on just one of its measures, the entire waterbody can be classified as failing to achieve good ecological status – even if it is performing well on all the other measures.
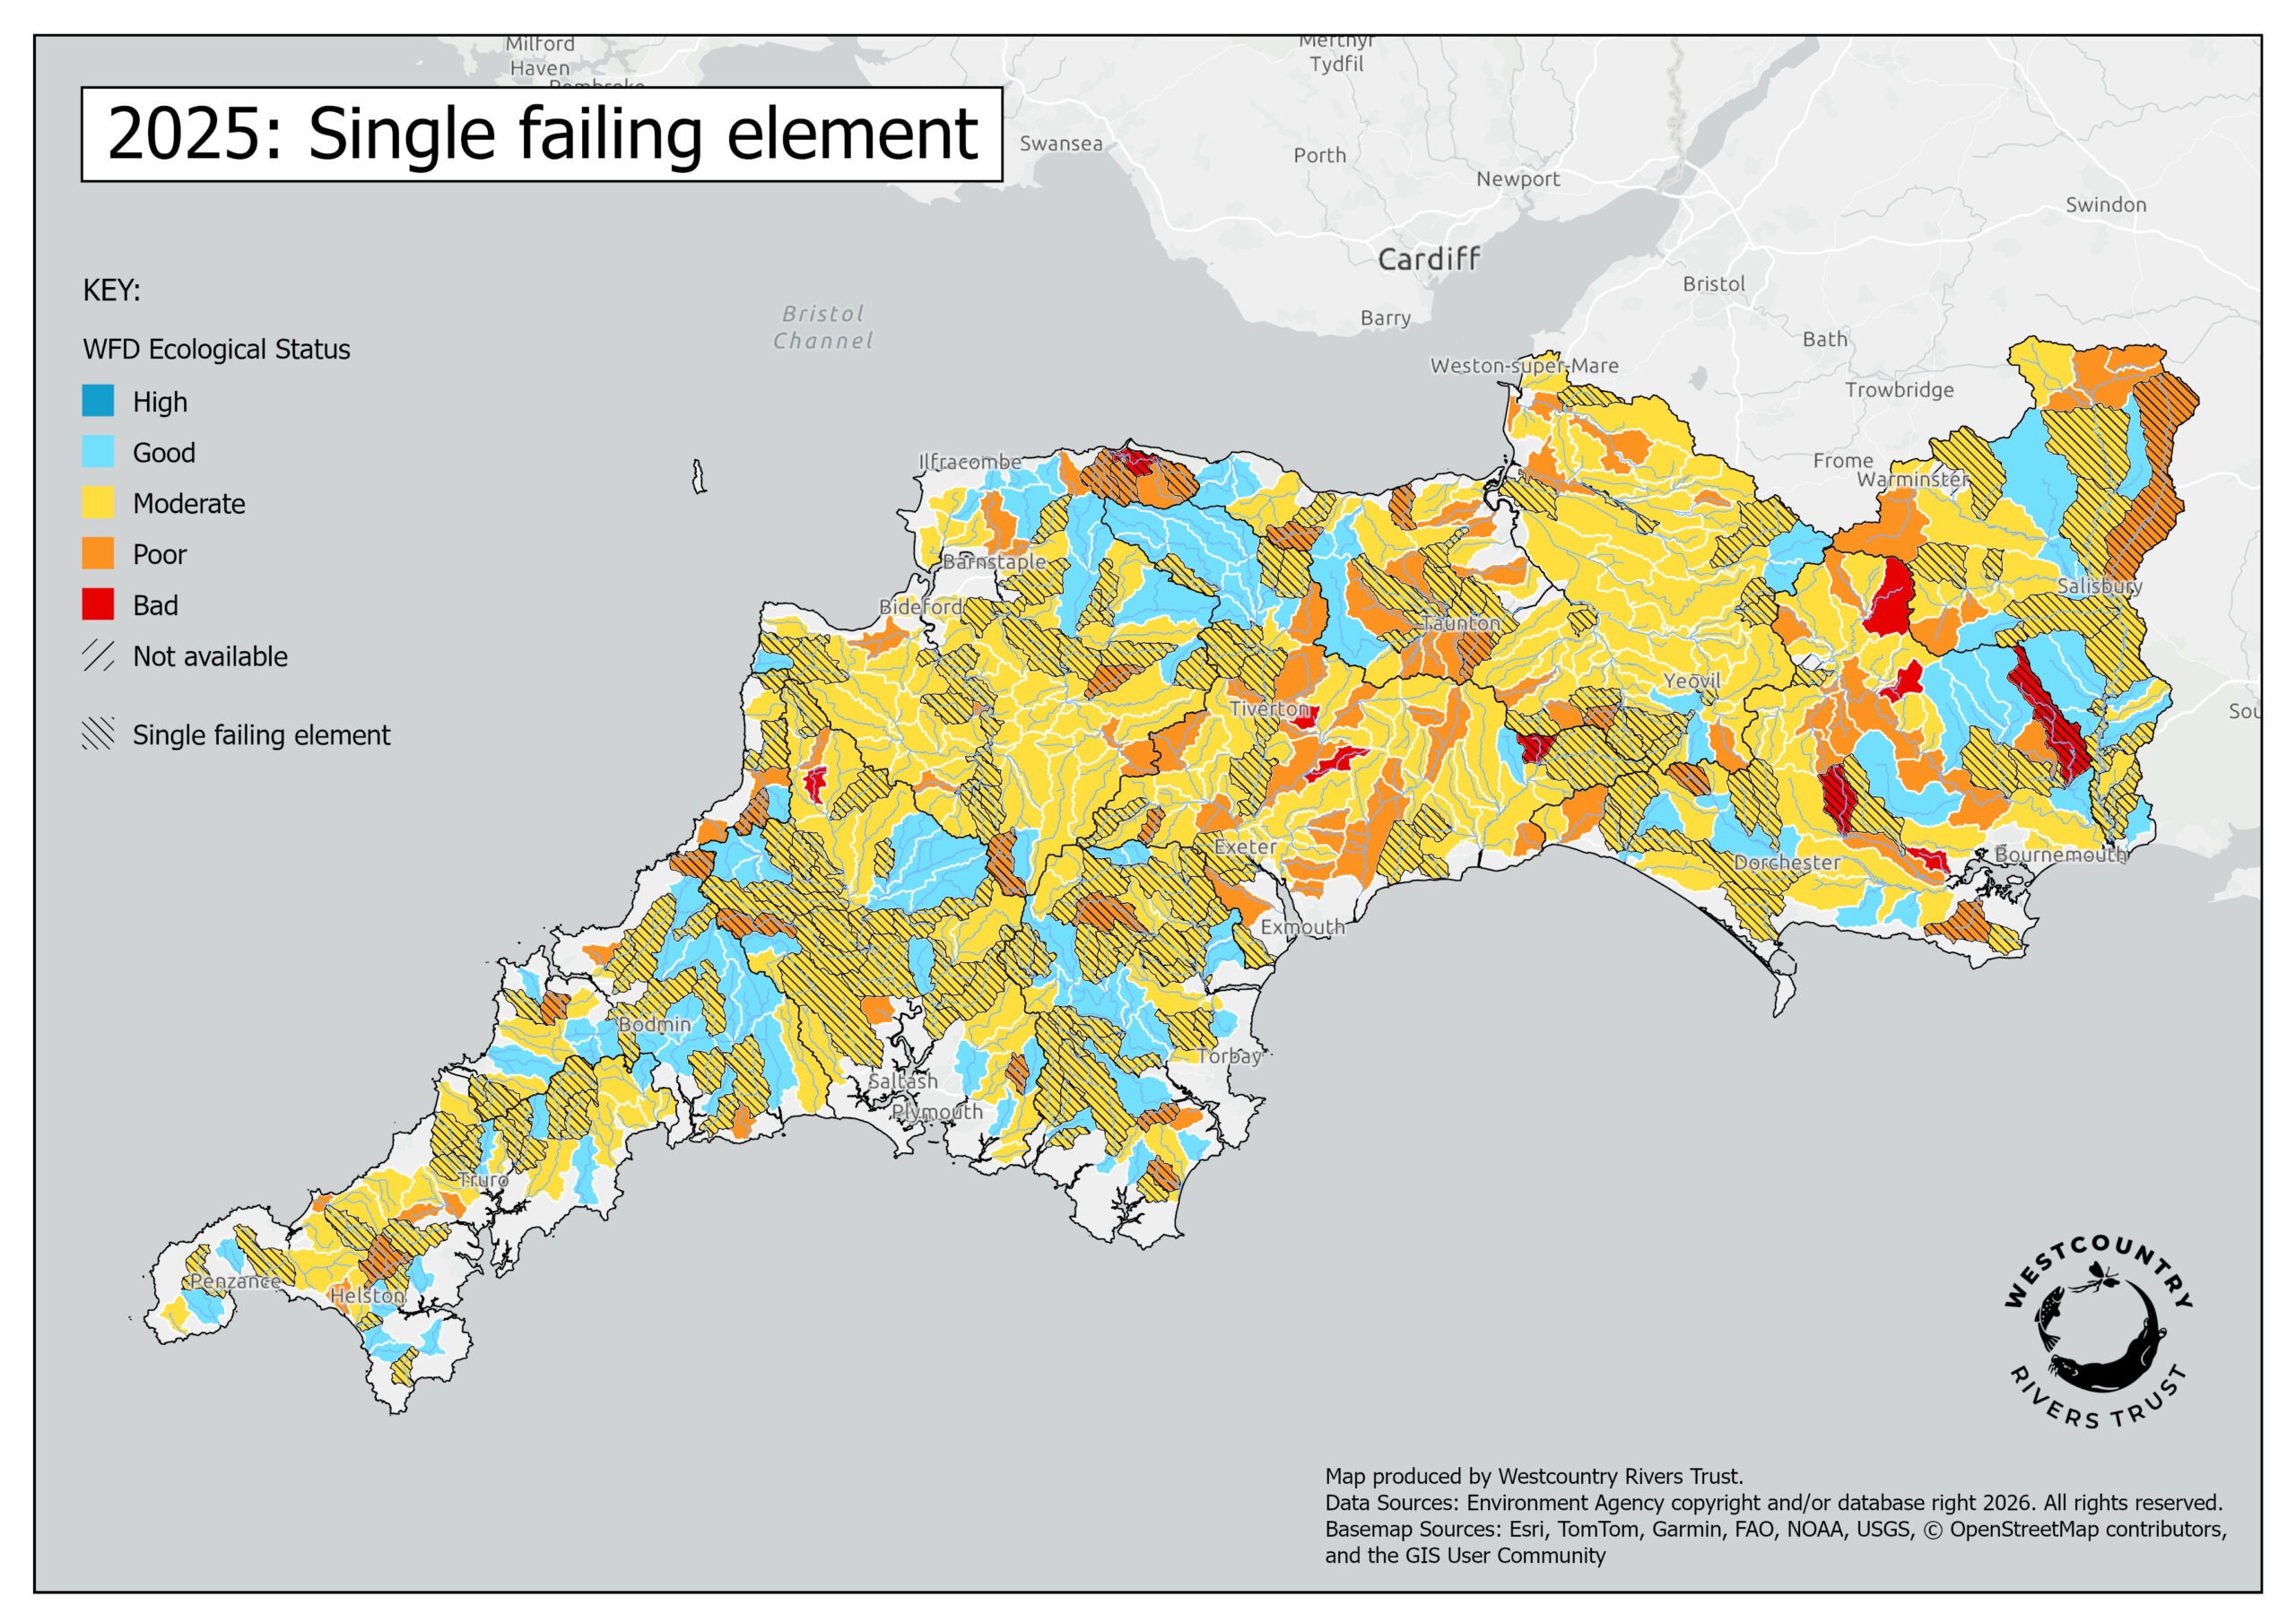
South West Waterbodies WFD 2025 overall ecological status. The map also shows which waterbodies are failing due to just one ecological element scoring less than good, under the one-out, all-out rule.
The River Walkham provides a useful example. It is rated ‘high’ on every measure except fish, but because of that one measure, its overall classification is ‘moderate’.
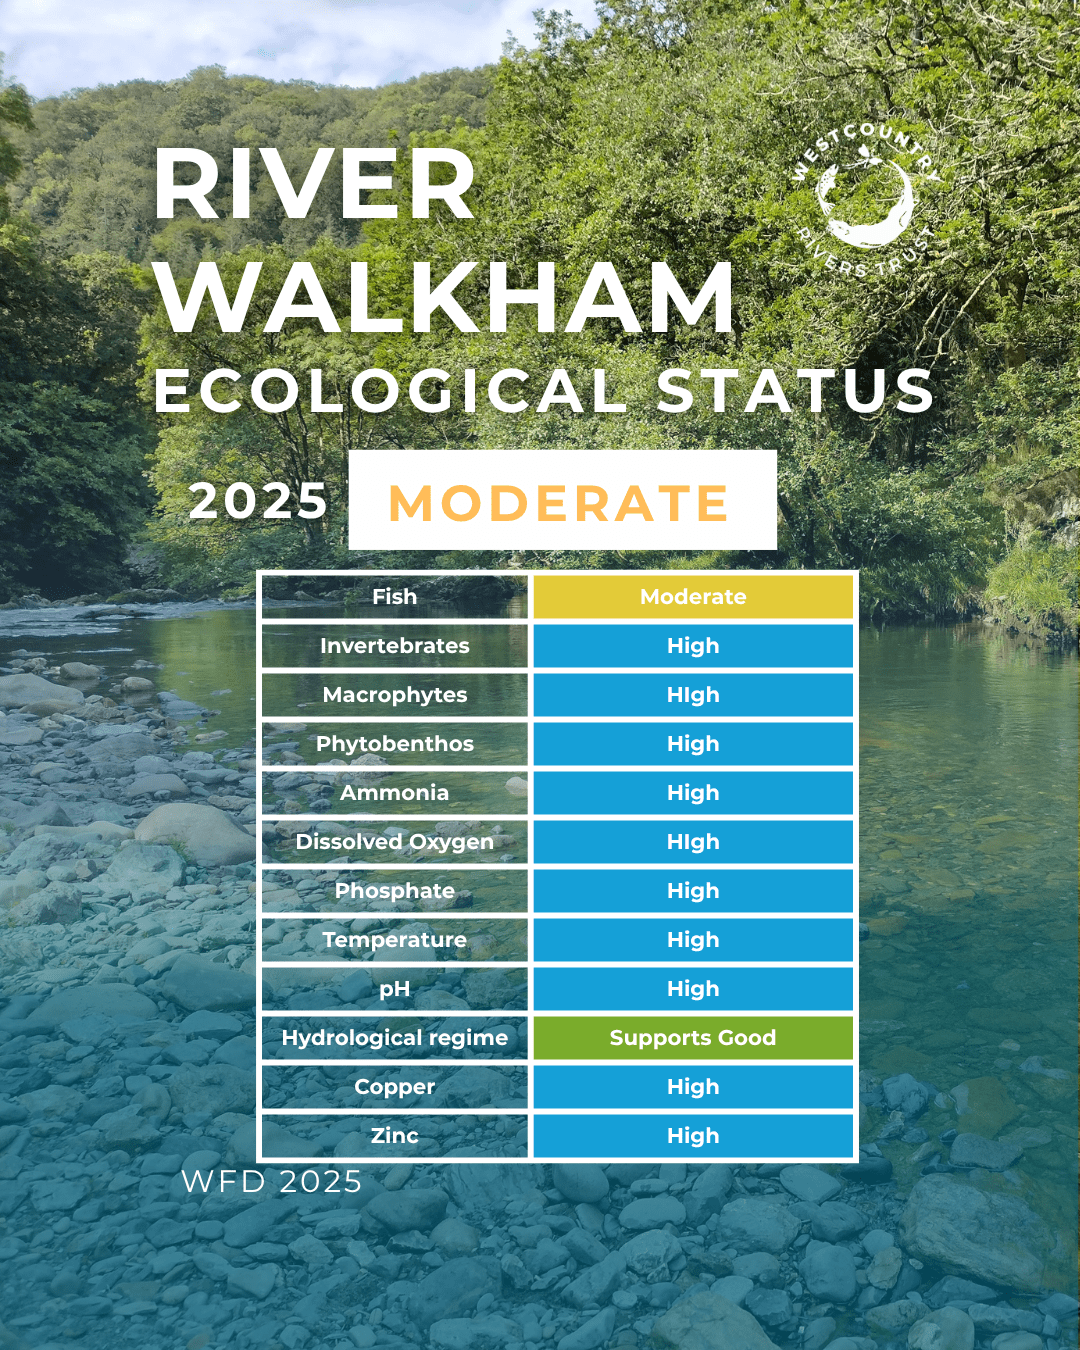
This approach is useful for identifying where there is a problem that needs attention, but it can also make the headline figures appear worse than the underlying picture of ecological health.
Look beyond the headline
One particularly encouraging statistic is that 81.8% of the individual ecological elements assessed in the South West are rated as ‘good’ or ‘high’.
That tells us something important: while only around one-fifth of waterbodies achieve an overall ‘good’ classification, the underlying health of many individual aspects of our waterways is considerably better than that headline figure might suggest.
None of this means that there isn’t a serious problem with our rivers. Sewage pollution, agricultural run-off, road pollution and other pressures continue to affect freshwater ecosystems and need to be addressed.
But environmental data needs to be interpreted carefully.
The headline percentage is an important starting point, not the whole story. Understanding how the data was collected, how classifications are calculated, what has changed between assessments and what is happening at an individual river level all matter.
Context matters when reading environmental data.
