Author: Matt Worthington, Evidence & Engagement Officer
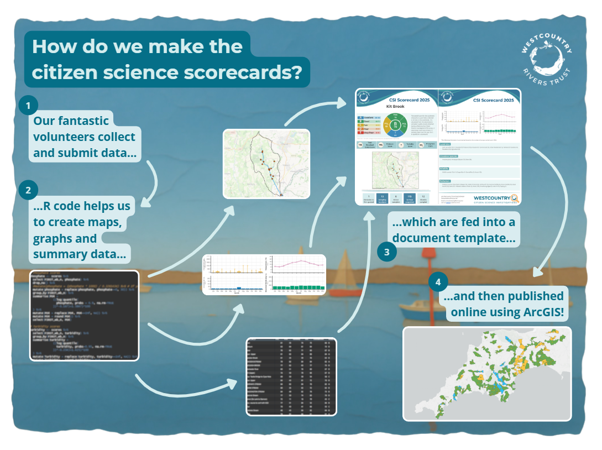
Over the past year, hundreds of you, our CSI volunteers, have continued collecting monthly observations and water quality data – helping to build one of the region’s largest citizen science freshwater datasets.
The latest scorecards bring that information together into a simple annual snapshot of river health for participating catchments. You can explore the new scorecards here: Westcountry Rivers Trust CSI Scorecards
What do the scorecards show?
Each scorecard combines a year of volunteer CSI data into an accessible overview of catchment condition. To qualify for a scorecard, a waterbody must usually have at least 12 surveys collected across the year.
The overall score is made up of four key indicators collected during CSI surveys:
Total Dissolved Solids (TDS)
Measures the amount of dissolved organic and inorganic material in the water. Increases above the usual baseline can indicate the presence of pollutants.
Pollution Score
Based on volunteer observations of visible pollution issues and potential pollution sources. Higher scores indicate fewer and/or less severe observed pollution pressures.
Turbidity Score
A measure of water clarity using the CSI turbidity tube. Lower clarity can suggest increased sediment or runoff entering the river.
Phosphate Score
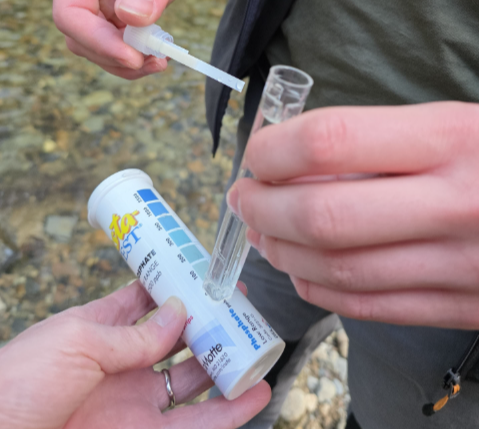
Phosphate occurs naturally at low levels, but elevated concentrations or spikes can indicate anthropogenic inputs. CSI volunteers use reactive phosphate strips to monitor changes over time.
How should the scores be interpreted?
The scorecards are designed as a reconnaissance-level overview rather than a regulatory assessment. They are most useful for identifying patterns, trends and potential hotspots across space and time.
Higher scores generally suggest healthier conditions within the context of the CSI methodology, but the real strength of the dataset comes from:
• long-term monitoring
• repeated monthly surveys
• high spatial coverage
• volunteer observations alongside water quality data
The scorecards help provide:
• a baseline for catchment condition
• evidence to support further investigation
• insight into changing pressures over time
• a way for communities to better understand their local rivers
As always, thank you to everyone involved in CSI. Your surveys genuinely help improve understanding of river health across the South West.